

No matter your industry or company size, all projects – and in turn, organizations – create data. Stalled product release? Boom, data. Employee on vacation? Boom, data. CEO just announced new business goals for this quarter? You get the point. In theory, all this data can help management make better business decisions and move your organization forward, but such data is only helpful if you know how to use it. A jumbled collection of spreadsheets is often inadequate to pull valuable insights.
Meisterplan offers multiple reporting solutions to power your data. Our Integrated Pivot Reports and Reporting API makes it easy to find and share relevant insights with everyone in your organization. With our project portfolio management and capacity planning reporting options, easily:
- Visualize over and understaffed people
- See how many of your projects align to a specific goal
- Understand how much remaining capacity a business unit has left
- Generate a list of all upcoming project milestones
- Get a resource-centric view of the projects in your portfolio
- And more
Integrated Pivot Reports
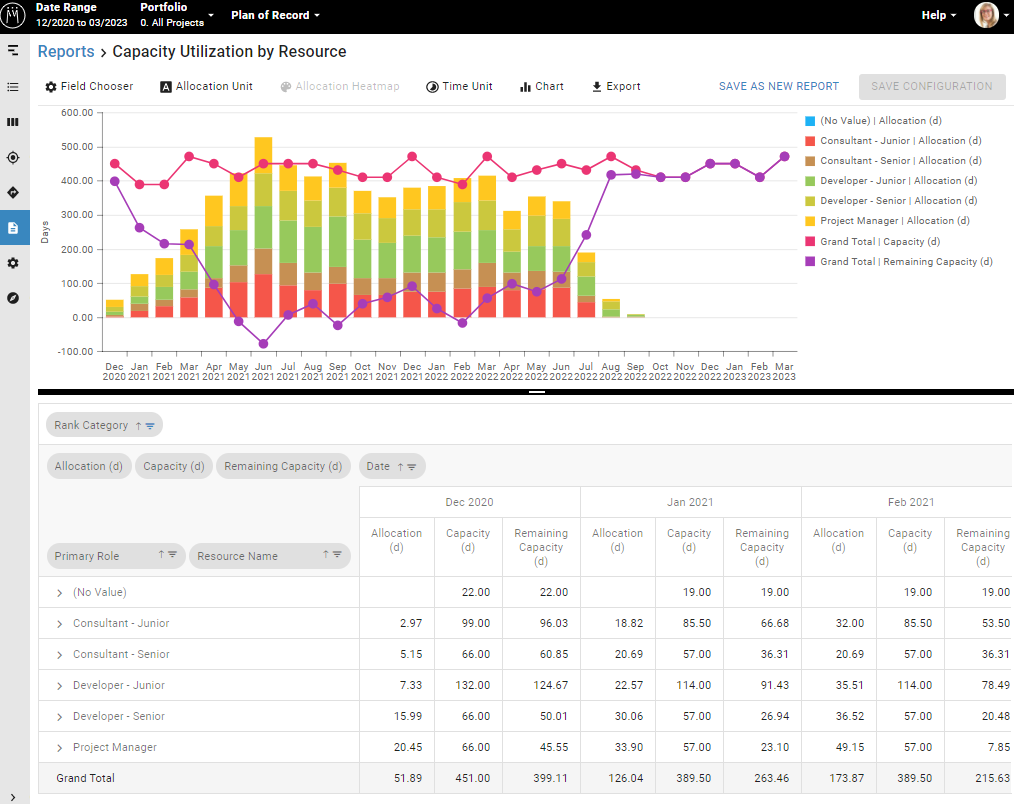
If you are new to Meisterplan, our Integrated Pivot Reports are a great place to start building new visualizations. Here, you can use preconfigured PPM report templates or build your own pivot report from scratch. All reports in this view are customizable so you can tailor the view to your liking. Meisterplan offers report templates on topics like resource utilization, financials and scenario comparisons.
These reports can be beneficial for virtually all stakeholders, including PMO leads, project managers, and upper management. For example, a head of PMO might be interested in a report that shows the total capacity utilization of the whole portfolio, while project managers would want to see the same report but drilled down to only the projects they manage. Upper management and decision-makers may find the chart at the top of the report most valuable, so they can easily scan and see how allocations line up to capacity over time.
Our Integrated Pivot Reports are a good option if you are looking for a reporting solution that you can easily share with decision-makers and other stakeholders. Because these reports are integrated into Meisterplan, you can effortlessly control who has the right to view or edit specific reports with User Group permissions if certain reports should not be shared. Maybe you don’t want your project managers from one business unit to edit the reports relevant to another business unit. This is one example where you may want to limit user report permissions. That being said, users who do have the rights to edit the reports do not have to navigate to an external tool to view them. This simplifies the reporting process and helps your team pull insights directly from Meisterplan.
Allocation Heatmap
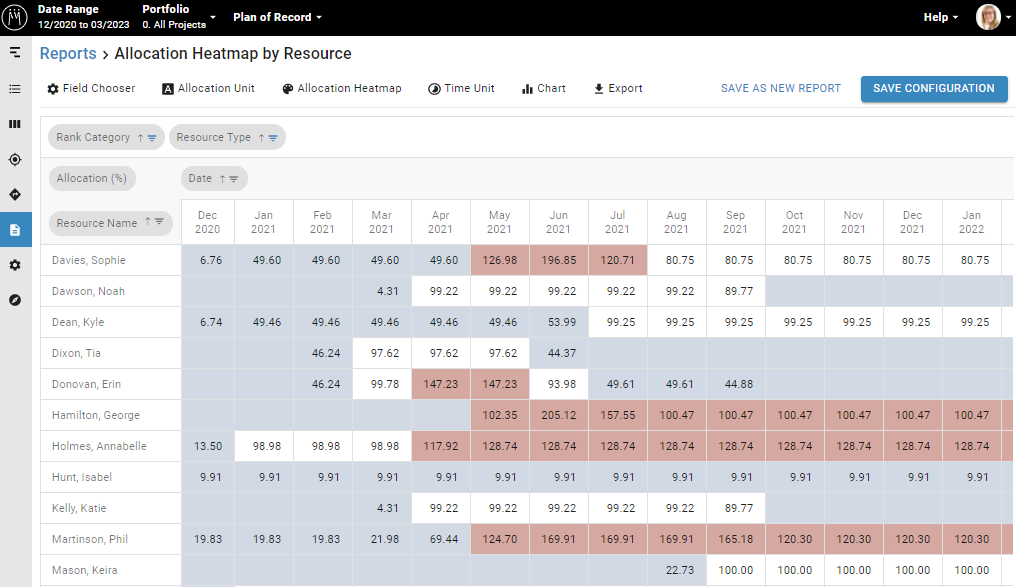
The allocation heatmap report can help you quickly understand who is overallocated and who can take on more work. With this report, the overallocated roles and resources are highlighted in red, while the underallocated roles and resources are highlighted in blue. This makes it easy to understand the utilization situation of your resources by simply scanning the page. You can also configure the allocation thresholds to align with your definitions of over and understaffed, ensuring the report makes sense in your context.
Resource-Centric View
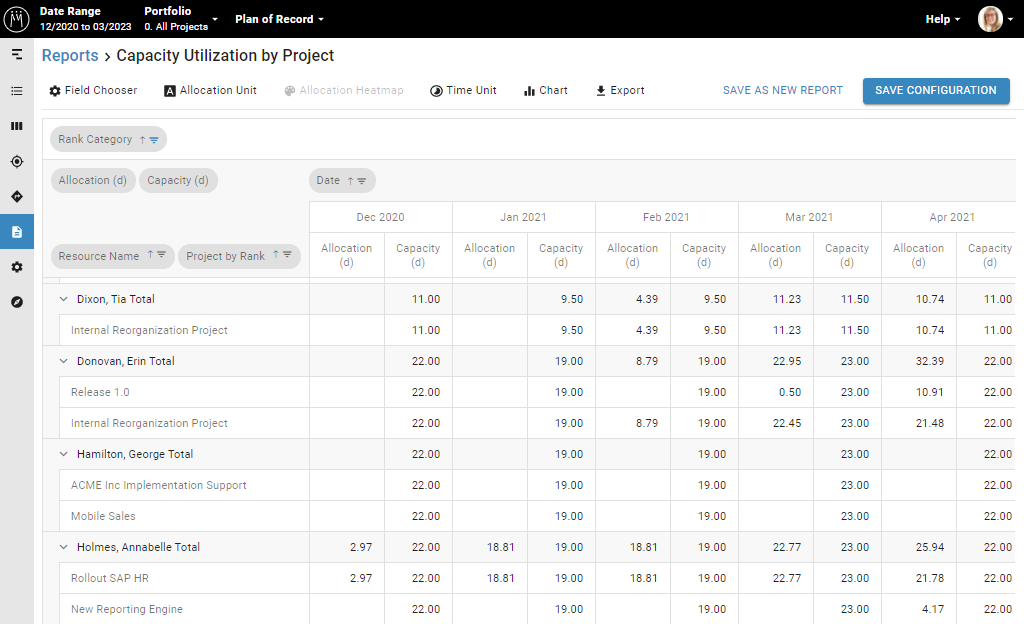
You can also use our integrated reports to create a resource-centric view of your portfolio. With this view, you can see what each person is working on and where they are focusing their time. Customize the report to show meaningful visualizations with timing and allocation units that are relevant to you.
Reporting API
Our Reporting API makes customization easy and offers visualization options outside of traditional pivot reports. This technology lets you connect to a multitude of reporting tools including Tableau, Power BI, Google Looker Studio, Excel, Qlik Sense and others. All you need to establish a connection between Meisterplan data and the BI software tool of your choice is an API token from your Meisterplan system and a BI software license. Learn how to generate an API token for a report here.
Using our Reporting API with another reporting tool is a great option when you want more flexibility in how the reports are constructed and what data they display. The Reporting API also allows you to report on additional data points, like milestones, that are not available in the integrated reports. With multiple API connections, you can also report on Meisterplan data alongside data from other tools like time tracking and billing software.
Google Looker Studio (or Google Data Studio)
The newest addition to our Reporting API options, Google Looker Studio, has one feature that drastically distinguishes it from other Business Intelligence solutions: Google Looker Studio is completely free! You heard that right. All you need to create a Google Looker Studio report is a Google account, making this option virtually accessible to everyone in your organization. With a variety of charts, tables and visuals readily available and the ability to create your own visuals via code, Google Looker Studio has countless options for data visualization. You can find Meisterplan templates for reporting with Google Looker Studio in our Help Center. Google also provides report templates for a wide range of topics that may be relevant to your context. You can check out these templates here.

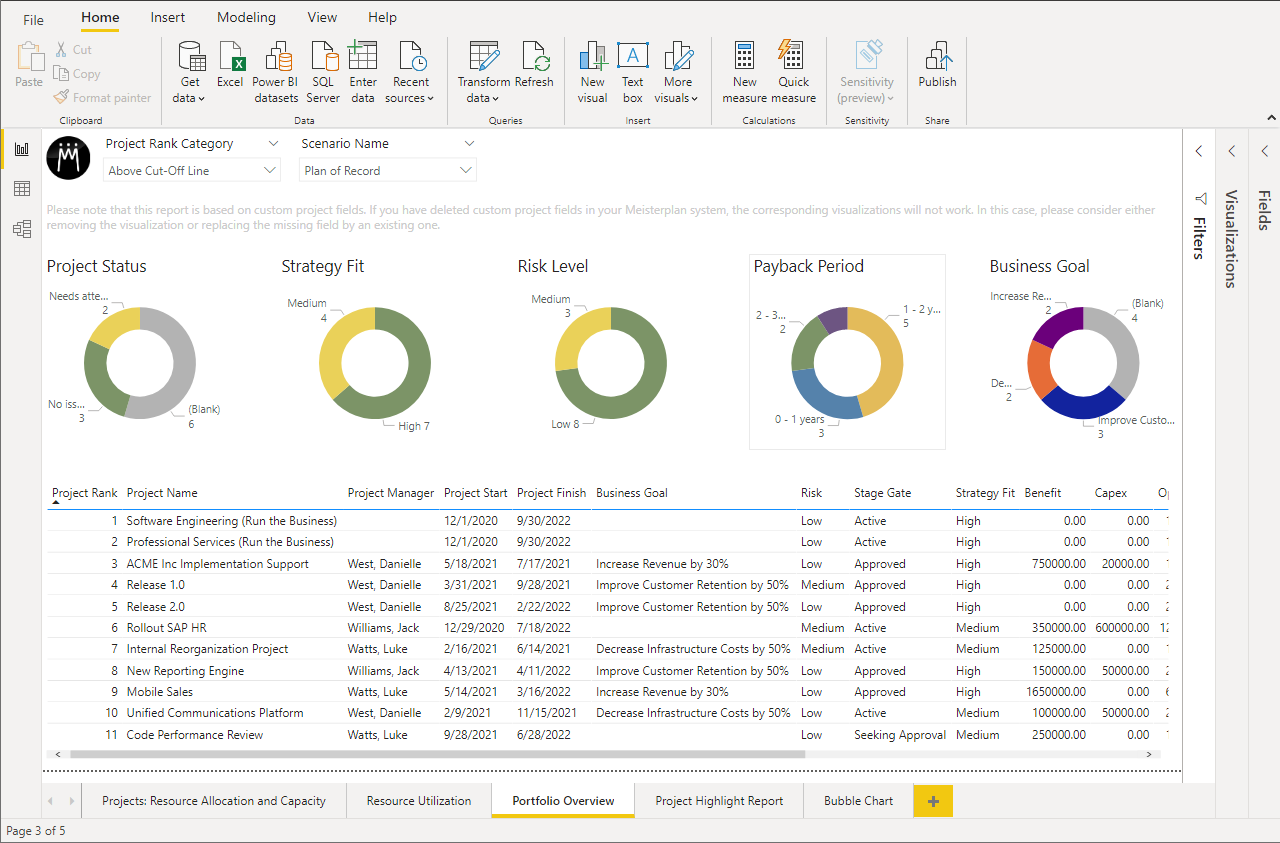
Power BI
A Microsoft product, Power BI is one of the most popular reporting tools used with our Reporting API, and for a good reason. Power BI is relatively inexpensive, easy to learn, and robust in capabilities.
Power BI offers 27 standard visualization options with the ability to download additional 3rd party visuals. Power BI is also intuitive to learn, with a vast library of educational content to ensure you know how to use the product to its full potential. Before I joined the marketing team, I worked with many Meisterplan customers on their Power BI dashboards. As someone new to complex report building, I learned everything I know about Power BI via free online sources, from how to create relationships between data sources to transforming data formats. If you are also new to Power BI, I recommend checking out the following learning modules:
While Power BI does require a paid license to download and create reports, this license is often included in Office 365 subscriptions. Before expensing a license yourself, check in with your IT team to see if one is already available to you.
To get you quickly working with your data, Meisterplan offers several Power BI templates in our Help Center. Our most used Power BI template is the Portfolio Report Template. This template provides visualizations for a complete view of the status of your portfolio and resource allocations.
We also offer two different templates for scenarios comparisons in Power BI. These reports can help you see changes in allocations and project planning between scenarios so you can make informed decisions. You can download all our Power BI templates here.
Tableau
Tableau is a comprehensive Business Intelligence solution that is often used in educational and corporate environments. This solution has many of the same capabilities as Power BI, a wide selection of visualization options and an intuitive user interface that makes adoption easy. However, Tableau is often a better choice for data analysts over Power BI as they have heavily invested in integrations to make reporting easy between platforms.
Positioned as an enterprise tool, Tableau is priced as such with a significantly higher subscription price than Google Looker Studio and Power BI and a tiered access structure. If you are in the education space, however, Tableau offers a discounted pricing structure with free licenses for students.
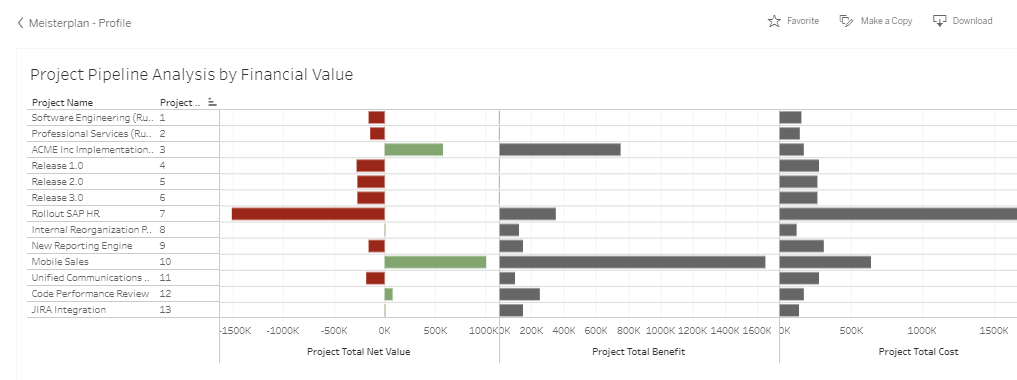
Tableau report templates for Meisterplan are also available to get you quickly started using your data. Download the Strategic Project Portfolio Bubble Chart or Project Pipeline Analysis by Financial Value templates via our help center our Meisterplan Tableau profile.
Getting Data with our Reporting API
While Tableau, Power BI and Google Looker Studio all utilize our Reporting API technology to create reports, the connection between these external reporting tools and Meisterplan are established in different ways. Google Looker Studio and Tableau connect to the Meisterplan Reporting API via a cloud-based connector. This connector lets you select all the data you want to visualize and import only what is relevant. Power BI, on the other hand, uses an API token to establish the connection. While these reporting tools differ in how Meisterplan data is collected, the database structure remains the same, ensuring the data is consistent across solutions.
Make Reports Work for You
Whichever reporting solution you choose, Meisterplan Integrated Pivot Reports and Reporting API can help you get a clear overview of your project portfolio and inform decision-makers with information that is most relevant for them. Schedule a one-on-one demo with our experts to learn more about all our reporting options and which solution would work best for you.
Read Next
Kasey Babcock

A coffee drinker from an arguably young age, Kasey was a natural fit for our Seattle-based Meisterplan team. Before joining the marketing team, Kasey ...

Data Quality: The Achilles Heel of Project Portfolio Management