

Histograms for Resource Management
In the course of your resource planning, you have undoubtedly already tried out various display formats to keep personnel requirements and available capacities in line with each other and to view several parallel projectsProjectA project is a time-limited undertaking with defined objectives and resources that delivers unique results and often includes complex tasks. and programs together. HistogramsHistogramA histogram in resource management is a graphical representation that helps to keep track of personnel requirements and available capacities. It shows how often certain values (e.g., person days or… are especially well suited to this purpose. They give you a visual overview while highlighting your strengths in the context of resource planning and simulation.
Histograms are used in traditional and agile project processes to obtain the necessary overview of capacities and requirements. This compressed display format is often used to compare available capacities with several parallel projects and their requirements and to simulate a number of planning scenariosScenarioIn project portfolio management (PPM), scenarios are potential ways that your portfolio can look, based on a set of well-defined assumptions and portfolio decisions. Scenario planning is used to forecast….
The Axes of a Histogram
To understand a histogramHistogramA histogram in resource management is a graphical representation that helps to keep track of personnel requirements and available capacities. It shows how often certain values (e.g., person days or… in the context of resource planning, it’s first helpful to break it down into its individual components. We start with the two axes:
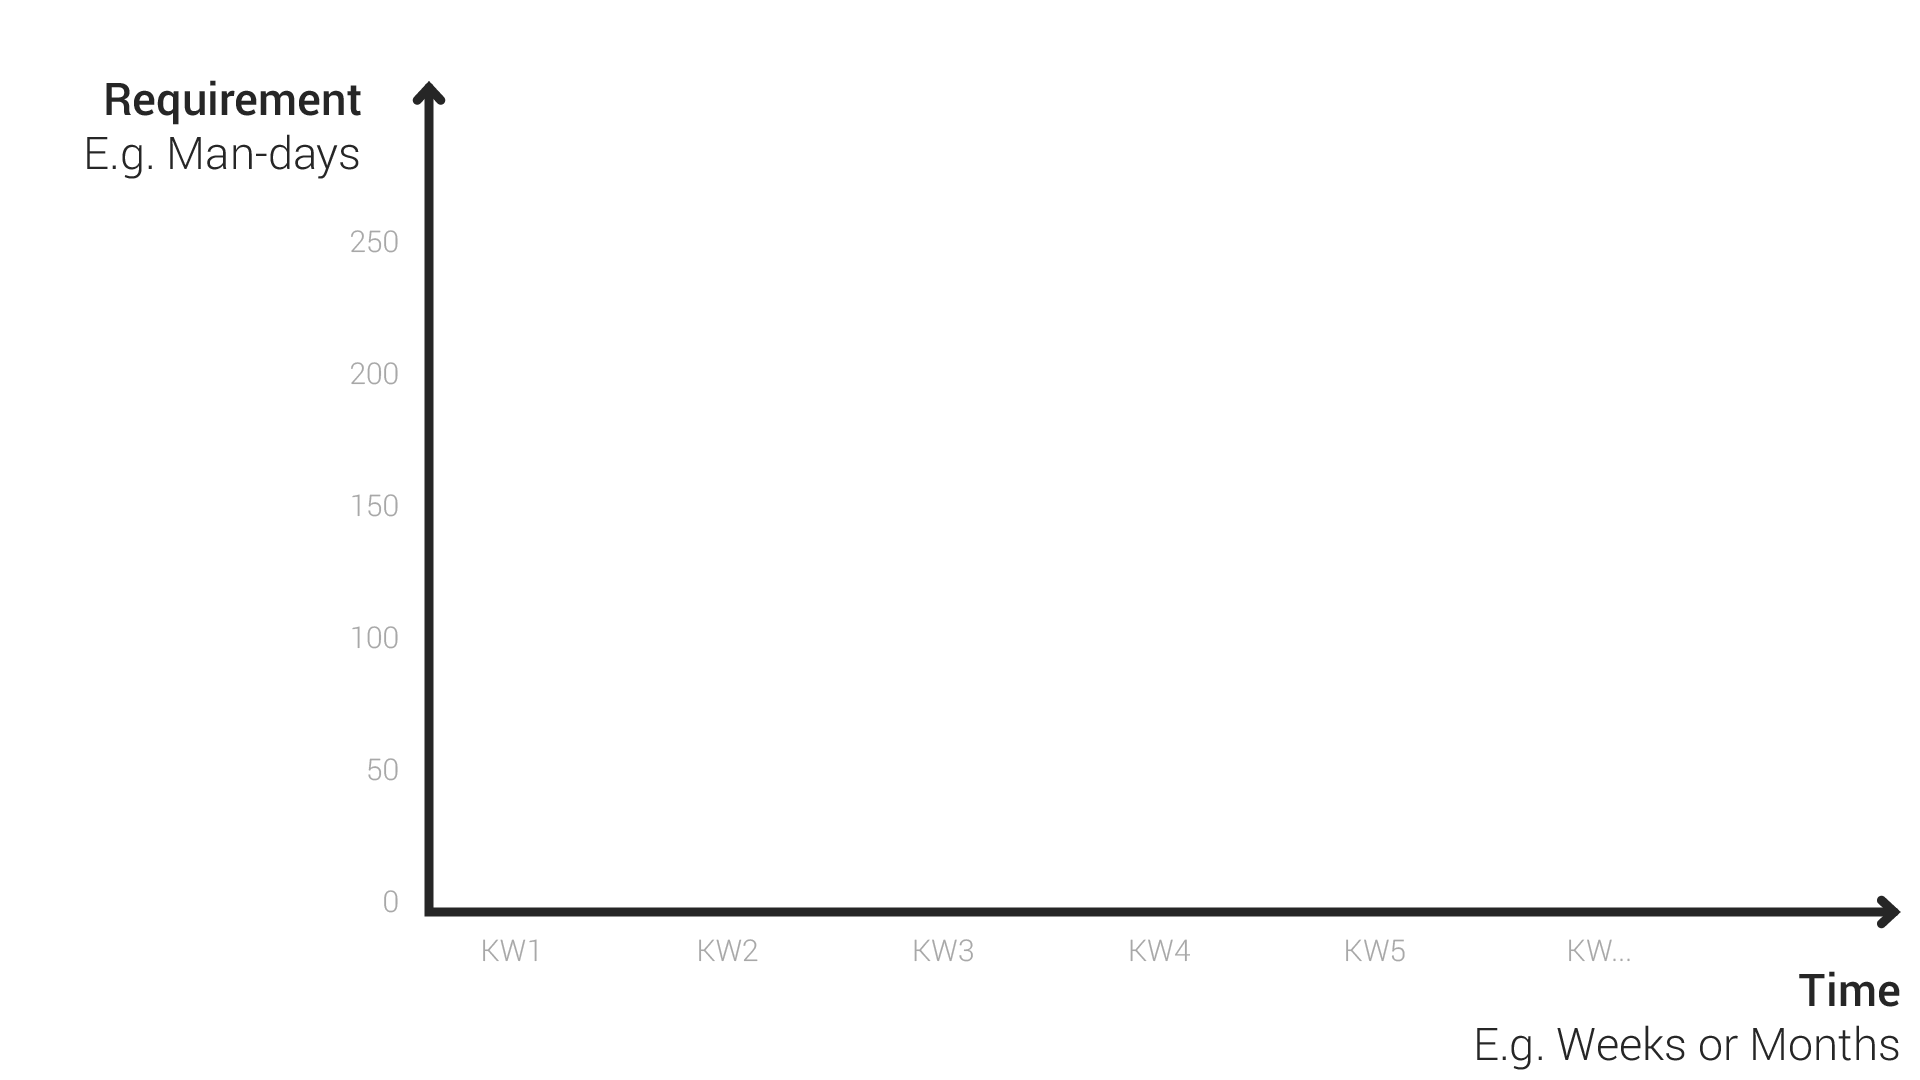
The Time Axis
Time proceeds from left to right on the x-axis, starting from the current time. The granularity of this variable, whether individual days or weeks and months, depends on the intended purpose and on how granular the resource management based on the histogram should be. In companies, planning and simulation is often done in weekly segments. Weekly segments are good for incorporating vacations, training, and the usual project phases. A month, in this case, would be too broad.
The Requirement Axis
The vertical y-axis of a histogram shows the necessary requirement. Possible units for the requirement axis are man-days, FTEsFTEsSynonym for → Full-Time EquivalentFull-time equivalents (FTEs) are a standardized unit of measurement in resource management representing the full-time capacity of a single worker., story points, or other suitable units. Agile teams, when planning resourcesResourceResources are all the people, places and things that you need to complete projects. The most important resource? Employees, of course!, often convert estimated story points into man-days in order to achieve overall comparability. Converting estimated efforts and capacities into the same unit for all teams and projectsProjectA project is a time-limited undertaking with defined objectives and resources that delivers unique results and often includes complex tasks. that need to be planned is a prerequisite for drawing conclusions from the histogram.
The Requirement Range
Perspective Based on Organization, Roles, People, or Teams
For initial resource planning, it is necessary to be able to allocate people, including those with a certain skill set, teams or several individuals at the same time. This simultaneous initial allocationAllocationAllocating describes the strategic process of identifying the correct resources for projects or individual tasks and assigning them accordingly. occurs, for example, by means of the decentralized projectProjectA project is a time-limited undertaking with defined objectives and resources that delivers unique results and often includes complex tasks. initiation for each organizational area. This is also the case when the attempt is made in agile organizations to define teams heterogeneously and to hold them together constantly.
Stacking the Requirements of Projects and Plans
A histogramHistogramA histogram in resource management is a graphical representation that helps to keep track of personnel requirements and available capacities. It shows how often certain values (e.g., person days or… creates a consolidated view of all allocations from the perspective of the resourceResourceResources are all the people, places and things that you need to complete projects. The most important resource? Employees, of course! (Resource 1 in the figure). This means that all projects to which Resource 1 is allocated in a given week will be stacked on top of each other like a mountain range. The height of the project boxes represents the requirement per project and Resource 1; the combined area of all projects is an indicator for the total planned effort for this resource.
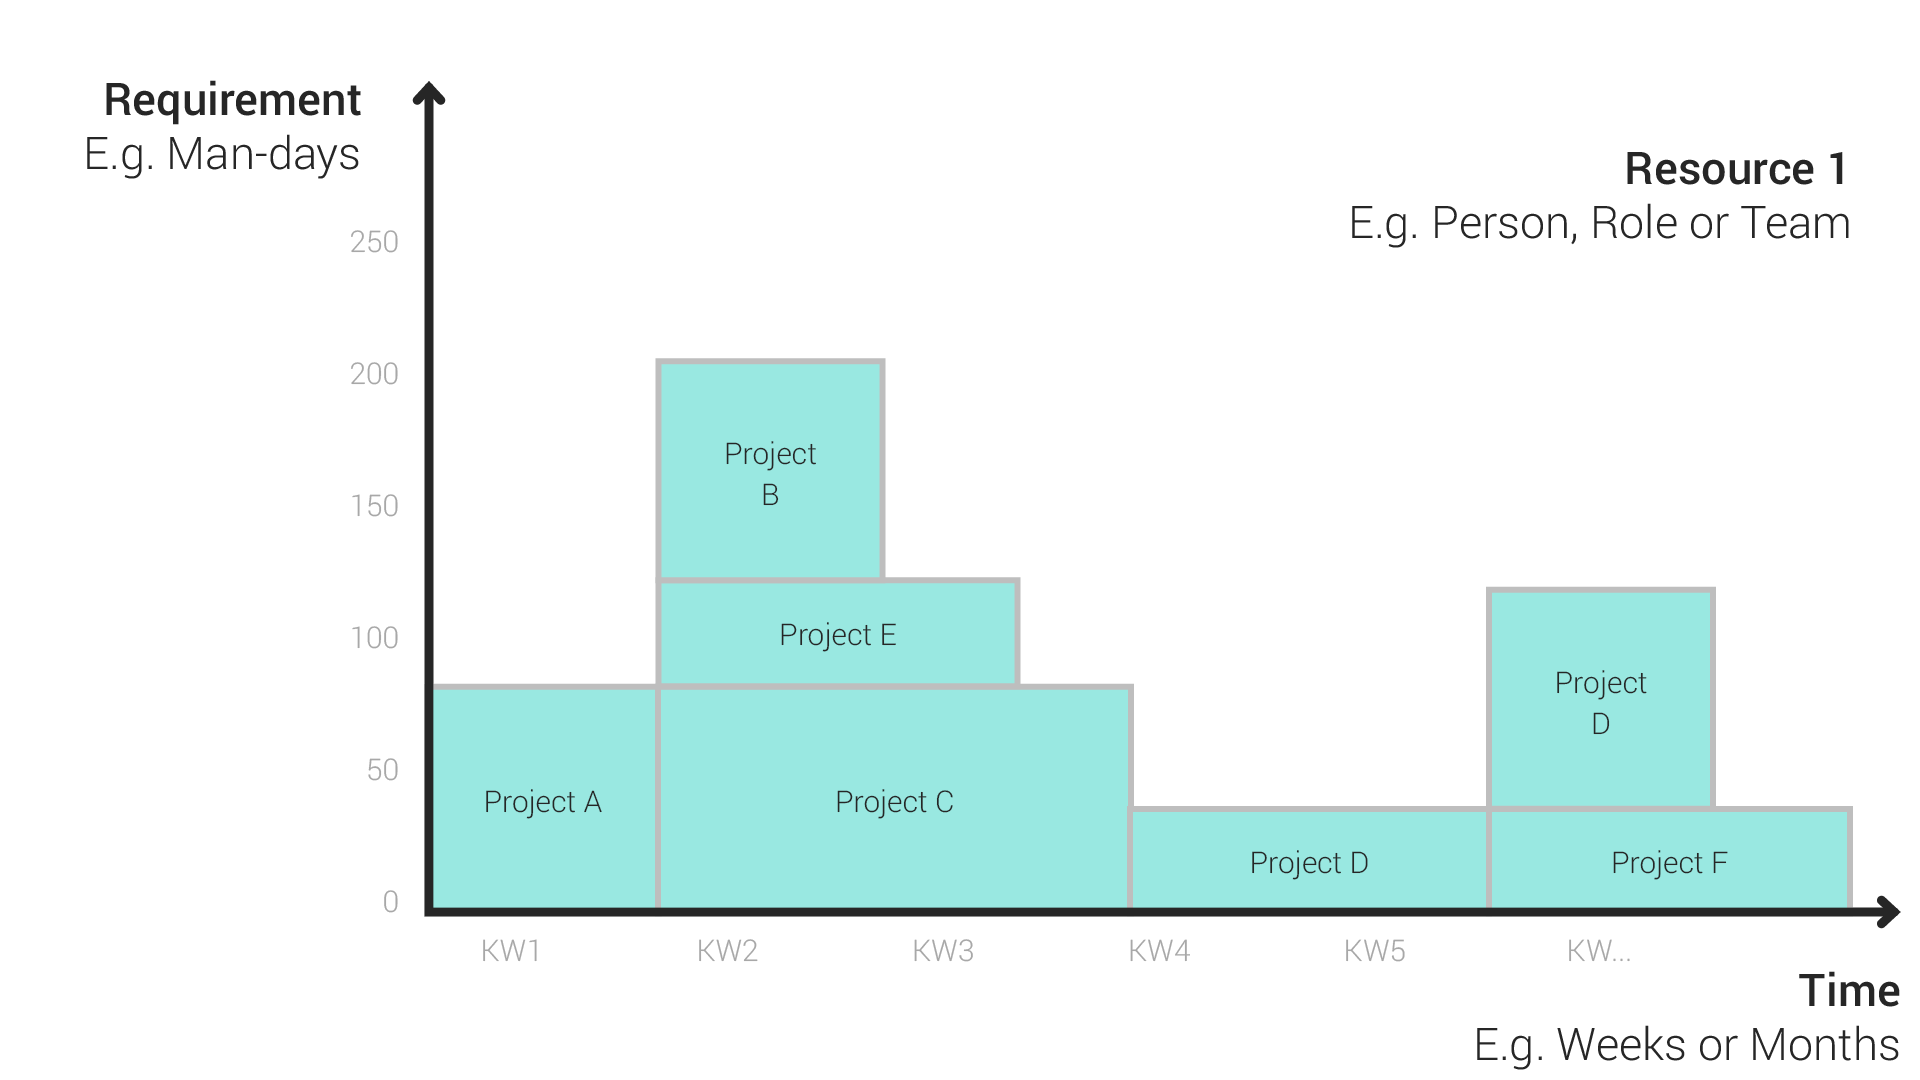
In the figure, Project C needs Resource 1 for a constant 80 man-days/week for three weeks between W2 and W4. Resource 1 could be testers, for example, to support planned integrationIntegrationAn integration is a virtual interface that connects different software programs and enables automated data exchange between them. This allows for more efficient processes, better planning, and consistent information. tests during this period. The total effort for the testing has been estimated at 240 man-days.
Stacking Order as a Parameter for Priority and Criticality
The projects of the requirement range in the histogram are stacked from bottom to top. On the bottom are the “set” high-priority projects whose implementation delivers the greatest goodwill or strategic contribution, or for which there is no longer any time buffer.
The Contour of the Capacities as a Basis for Comparison
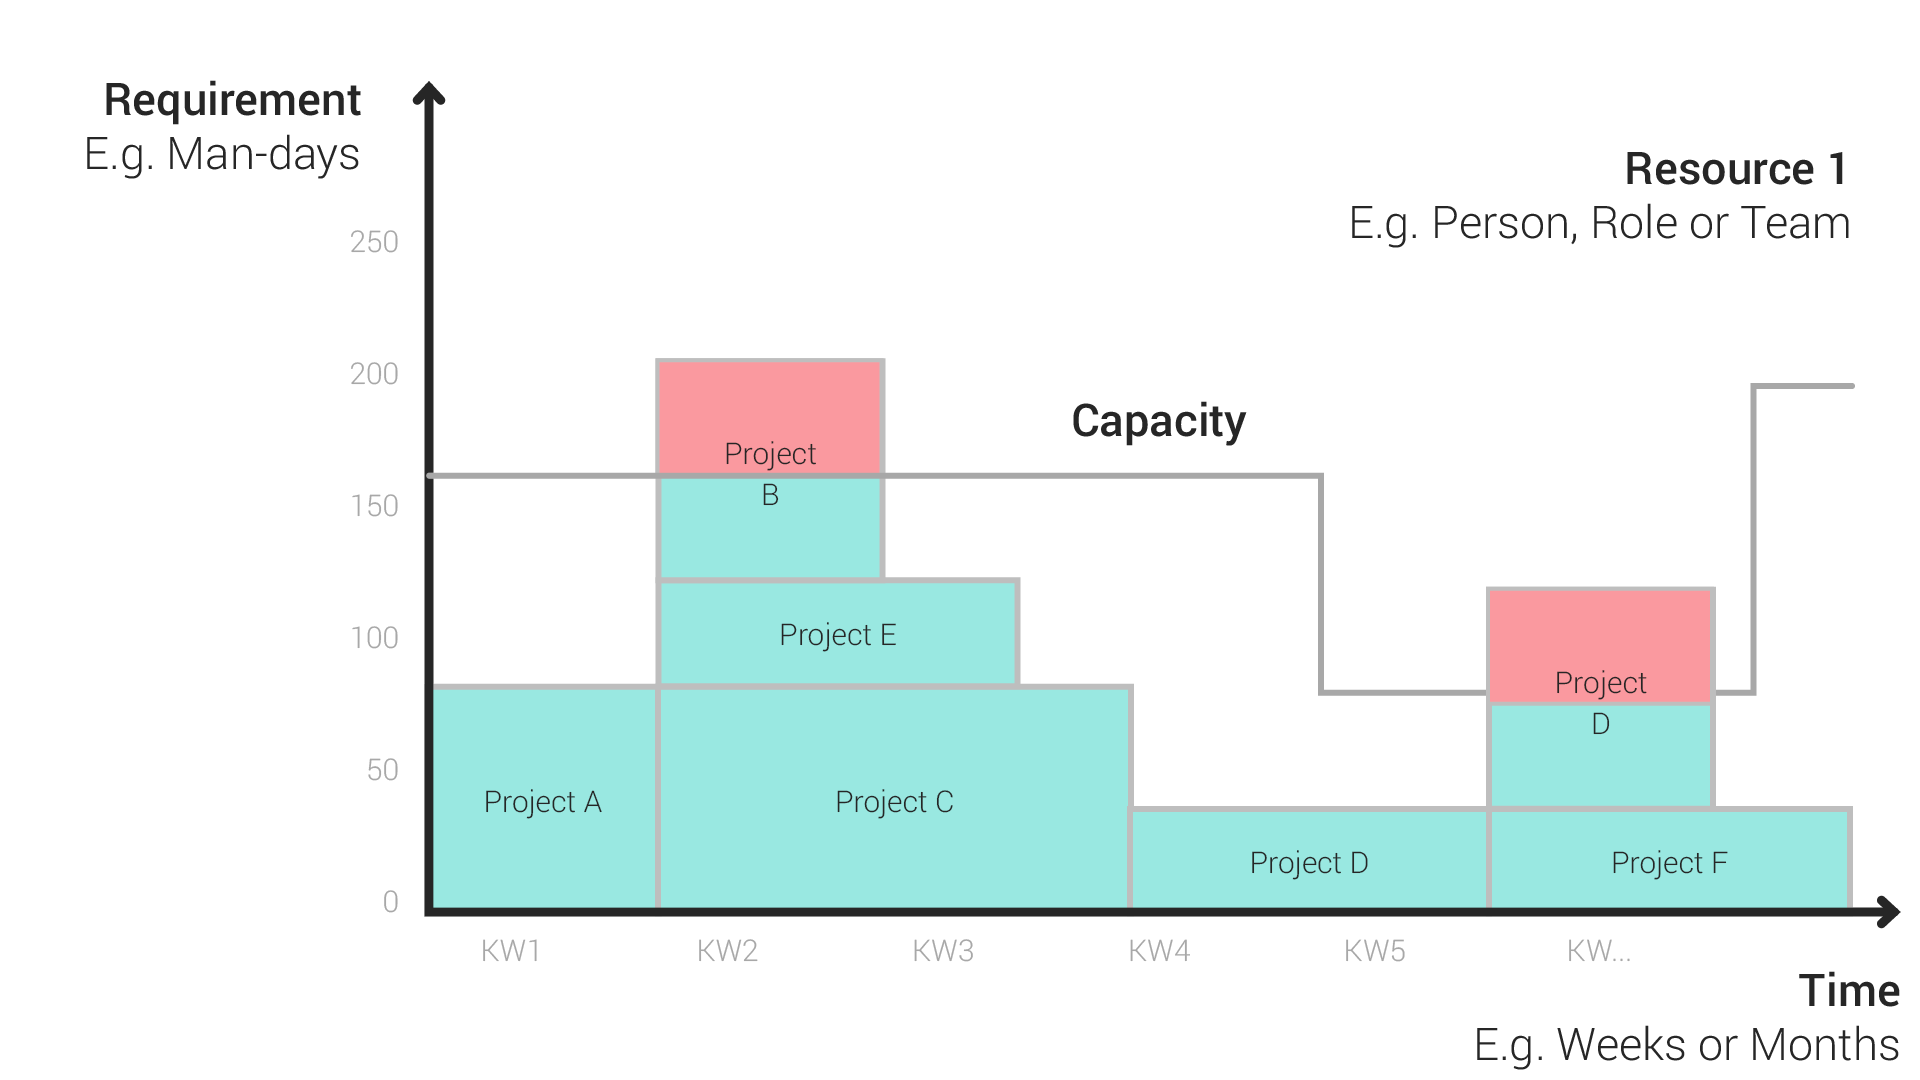
To enable comprehensive resource planning, the requirement range needs to be compared to the available capacities. Displayed as a contour, the following aspects are made visible at a glance:
- When more or fewer capacities are available per organization, team or individual resource. This can be influenced by planned absences, hires, and fluctuation or by external reinforcement at certain times.
- Which projects are affordable at the planned time and existing constraints.
The contour is defined in the same unit as the requirements displayed in the histogram and is in relation to the same resources. This means that the height of the graph represents, for example, the sum of all tester capacities in one calendar week.
Histograms in Use
Constraints and Actions from the Portfolio View
A histogramHistogramA histogram in resource management is a graphical representation that helps to keep track of personnel requirements and available capacities. It shows how often certain values (e.g., person days or… provides an easy overview of the timing and size of constraints. All projectsProjectA project is a time-limited undertaking with defined objectives and resources that delivers unique results and often includes complex tasks. that reach above the capacity contour are at risk of not having the required resourcesResourceResources are all the people, places and things that you need to complete projects. The most important resource? Employees, of course! available in certain time periods.
A portfolio simulation with histograms can be used to pursue the planning objective of reducing this risk and balancing the ratio of requirements and available capacity. In the process, the following actions can help resolve the “red” areas in the histograms:
- Move projects with time buffers
- Stretch projects over time
- Reduce the scope and associated resource requirements
- Interrupt and resume projects
- Shrink projects to gain time buffers
- Expand the capacities, e.g., with external employees
In addition to balancing capabilities, portfolio planningPortfolio PlanningPortfolio planning is the process by which companies decide which projects they want to carry out. This ensures that projects are in line with the company’s objectives and that the… involves allocating priorities that provide clarity in cases of doubt regarding who definitely has resources available and who does not. As mentioned above, high-priority requirements or projects are always found at the bottom of histograms.
Risk Management for Projects
For project managers, it is particularly helpful to be able to view and evaluate all histograms of the roles or resources allocated to a given project. This can lead to risk-minimizing actions, such as adjusting procedures, or to a planned, timely transfer of knowledge to bridge the loss of experts.
Histograms in Resource Management
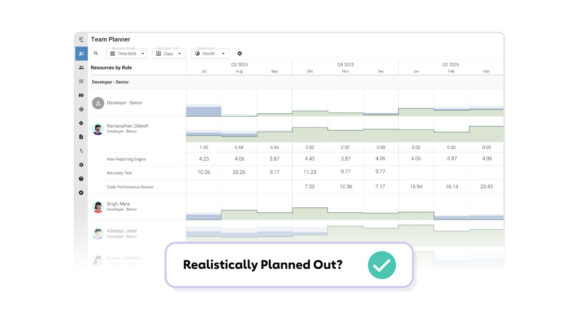
HistogramsHistogramA histogram in resource management is a graphical representation that helps to keep track of personnel requirements and available capacities. It shows how often certain values (e.g., person days or… can be used as a means of comprehensive support for a resource planning projectProjectA project is a time-limited undertaking with defined objectives and resources that delivers unique results and often includes complex tasks.. Important conclusions can be drawn from the charts – both in the multi-project view and for individual departments or projects – with regard to constraints, capacities, requirements, and priorities. In addition, if histograms are embedded in planning and simulation tools, they provide a highly flexible control view of capacities and resourcesResourceResources are all the people, places and things that you need to complete projects. The most important resource? Employees, of course! based on a consistent data basis and dynamic view selection.
Even though histograms are tremendously helpful in resource managementResource ManagementWhen it comes to resource management, the focus is on the optimal planning, coordination and monitoring of resources. The term “resources” includes things like employees, budgets, materials and time., they can be tedious to maintain and create. Meisterplan is a project portfolio management and resource management tool. Histograms can be updated in real-time and users can use scenario planning to build the best portfolio. To see how easy resource management histograms are in Meisterplan, sign up for a free 30 day trial.
Read Next
Jens Hirschinger

Jens has gathered extensive experience in resource management, project portfolio management, and agile methods in his nearly 20 years as a project manager, adviser, ...
Resource Planning Software
Resource planning software Meisterplan. Coordinate your people across projects and teams — without detailed task-level planning.