Leading Companies Trust Meisterplan
The Right Report to Answer Your Portfolio’s Most Asked Questions
Make use of our integrated reports or the BI tools you’re most experienced with to make data-driven decisions about your projects and capacities.
Would you like to display the content of YouTube? Then please confirm this with one of the two buttons. Please note that data will be exchanged with a third-party provider.
More Information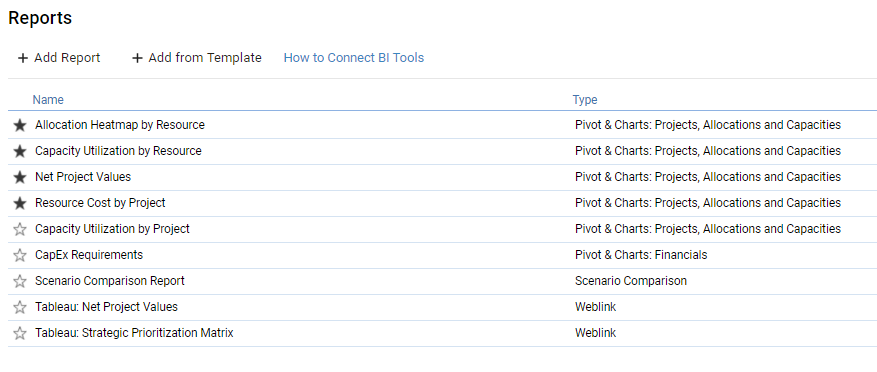
Customizable Pivot Reports
Quickly answer questions about project performance with our report builder or start with one of our pivot reports.
- Create reports to understand project performance, resource utilization and financial data
- Utilize any fields available in your Meisterplan system in reports
- Enrich your data by connecting to existing BI tools
Optimize Capacity with Our Allocation Heatmap
Get a quick understanding of capacity in your organization on a role or resource-based level.
- See at a glance whether resources are under or overallocated
- Visualize your allocation data with customizable thresholds to identify trends, patterns and conflicts
- Export the allocation heatmap report for easier sharing


Dashboard for Portfolio Level Insights
See your portfolio status, identify need for action and make decisions on portfolio plans.
- Use different charts, such as doughnut and bar charts, to visualize your data in a way that's easy to understand
- Assess KPIs within your chosen date range, portfolio filter and scenario
- Add, move, edit and filter cards to configure your dashboard so you see only the information that's relevant to you
Enhance Your Data by Connecting External BI Tools
Already have BI software? You can use our Reporting API and connectors to connect your Meisterplan data to your preferred reporting software.
- Connect Meisterplan to Tableau, Power BI, Google Looker Studio, Excel and more
- Keep the same reports and visuals management is used to
- Use our Tableau and Power BI report templates to get up and running as fast as possible

The Lean PPM approach helps us have a solid and up-to-date database. I am able to bring figures to the table and easily map our initiatives to make the right decisions quickly. We are very satisfied with our partnership with Meisterplan, and every new day confirms the usefulness of this solution.
RIMOWA
With Meisterplan, we can always see what exactly the impact of doing any project is – and it´s really simple to use.
Buckinghamshire County Council

I give Meisterplan an A+ for the experience of modifying the project timeline and resourcing. Consider this model if you’ve struggled to forecast resource capacity using spreadsheets or large commercial tools.
Info-Tech Research Group
Without Meisterplan, portfolio decisions during crises like this are not well-informed and have unpredictable outcomes.
Bayer UK
With Meisterplan we easily can align our projects with business goals, resources and financials. This led to fast and reliable business decisions.

The biggest value that Meisterplan gives us is the ability to communicate across the enterprise what’s being worked on. It adds transparency as to why things are stacked ranked, and it holds people accountable to decisions that were made. This has resulted in more projects being completed on time, and more projects being aligned to a strategy, because they were accurately prioritized.
Very usable for enterprises with large number of projects to prioritize. It was designed to help PMOs and resource managers find the best fit in the project portfolio. It is easy to use and easy to implement. The user interface is really simple but offers useful functionalities for project and resource planning and prioritization.
Try Meisterplan for Free
Try Meisterplan for 30 days with your own data and full product functionality.