Leading Companies Trust Meisterplan
The Right Report to Answer Your Portfolio’s Most Asked Questions
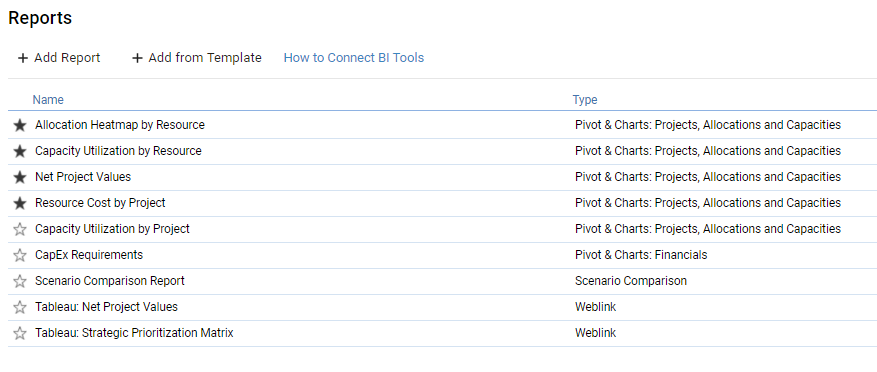
Make use of our integrated reports or the BI tools you’re most experienced with to make data-driven decisions about your projects and capacities.
Would you like to display the content of YouTube? Then please confirm this with one of the two buttons. Please note that data will be exchanged with a third-party provider.
More InformationCustomizable Pivot Reports
Quickly answer questions about project performance with our report builder or start with one of our pivot reports.
- Create reports to understand project performance, resource utilization and financial data
- Utilize any fields available in your Meisterplan system in reports
- Enrich your data by connecting to existing BI tools
Optimize Capacity with Our Allocation Heatmap
Get a quick understanding of capacity in your organization on a role or resource-based level.
- See at a glance whether resources are under or overallocated
- Visualize your allocation data with customizable thresholds to identify trends, patterns and conflicts
- Export the allocation heatmap report for easier sharing
Dashboard for Portfolio Level Insights
See your portfolio status, identify need for action and make decisions on portfolio plans.
- Use different charts, such as doughnut and bar charts, to visualize your data in a way that's easy to understand
- Assess KPIs within your chosen date range, portfolio filter and scenario
- Add, move, edit and filter cards to configure your dashboard so you see only the information that's relevant to you
Enhance Your Data by Connecting External BI Tools
Already have BI software? You can use our Reporting API and connectors to connect your Meisterplan data to your preferred reporting software.
- Connect Meisterplan to Tableau, Power BI, Google Looker Studio, Excel and more
- Keep the same reports and visuals management is used to
- Use our Tableau and Power BI report templates to get up and running as fast as possible


